“Computer Vision algorithms enable machine to indentify and classify objects, then react accordingly. ”
CV & Imaging
Week 1
Lecturer: Prof. Hamid Dehghani
F2F: 12 noon Weds, 3pm friday, 10am Mon-Zoom (Lab- section)
Matlab-Based tutorial
Robotic Vision
Content
Start with what we look up things: to know what is where, by looking. P15~16
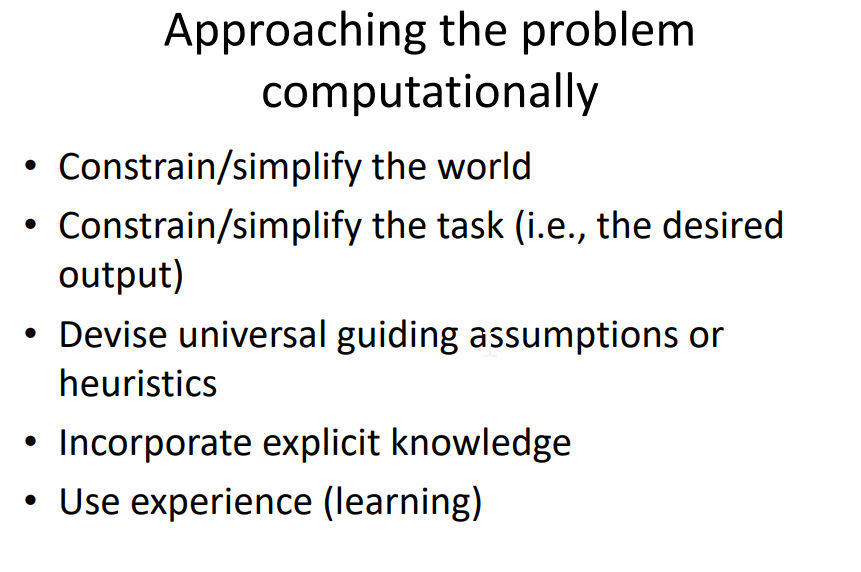
prior knowledge (physics etc.) matters
Evolution of Eyes
We see things cuz of light reflect..
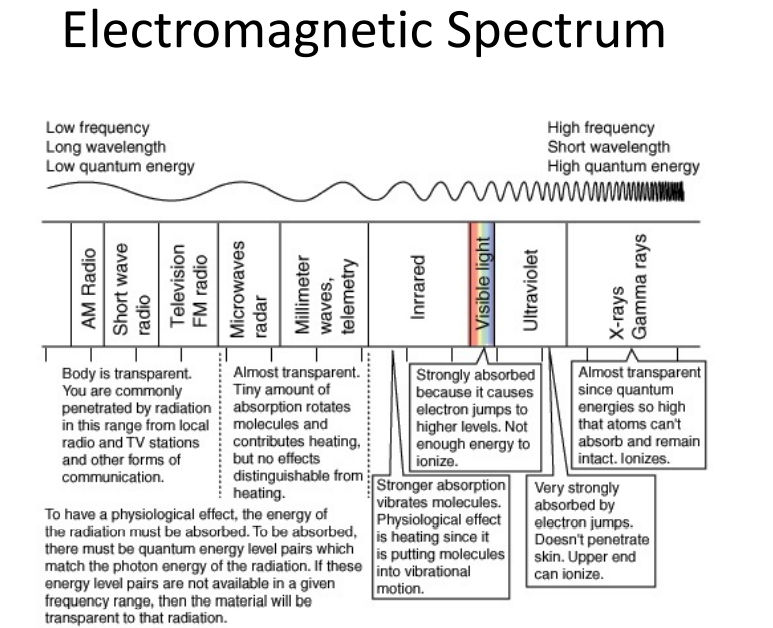
different fre light react diff with material, thus how we collect the info.
Humans perceive elevtromagnetic radiation with wavelengths 360-760nm
E is Eberfy, c = speed of light,
Photocell
Only capture light from 1-direction
Multi cell
capture different intensity of the light with better direction resolution
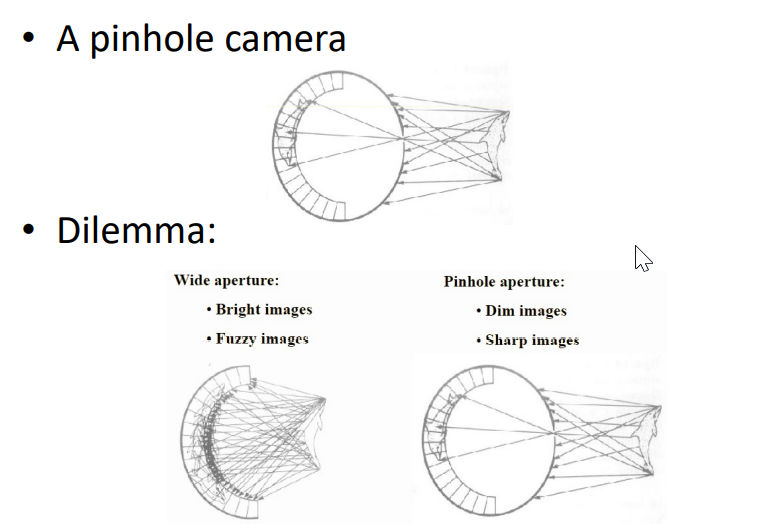
Pin Hole for only projection
It is now a sharp image but throw away lot of info
Lenses
Snell’s Law - looks more shallow than real
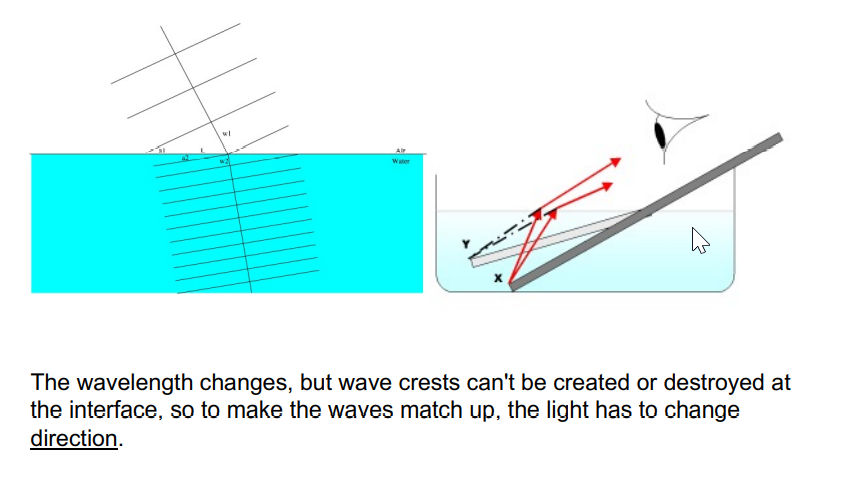
So a lens to collect and focus more info…. with the snell’s law.
pupil control the light amount
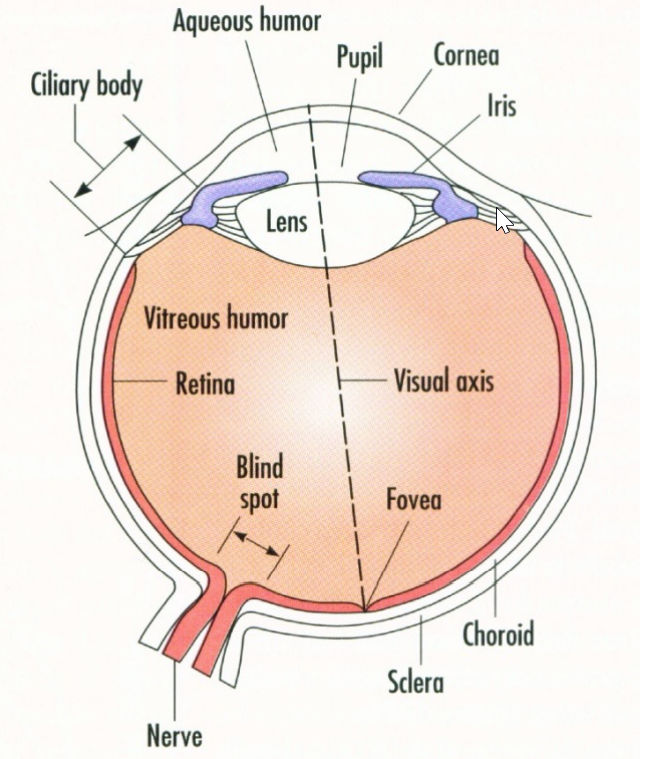
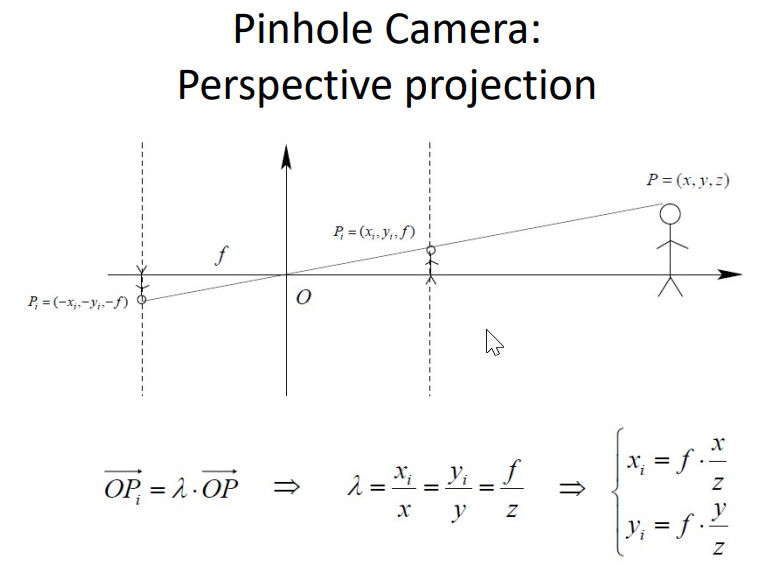
Up-side brian process the down-side vision ?????
Check it out.
What our eyes see is actually upside-down..
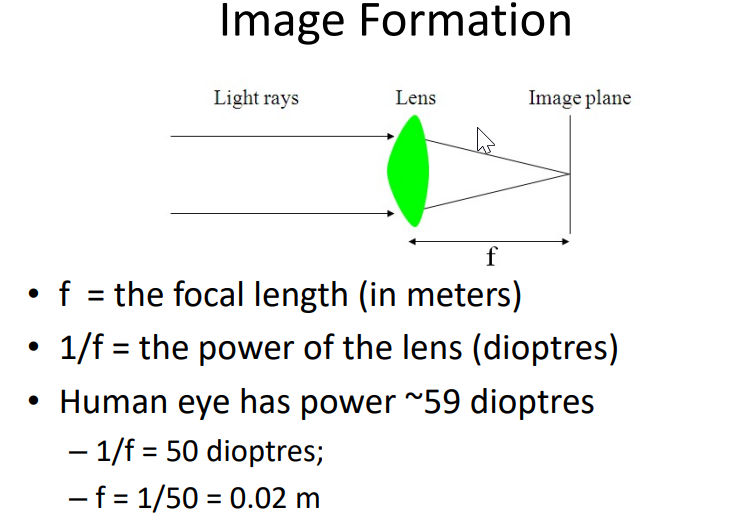
How much magnify or reduce the image.
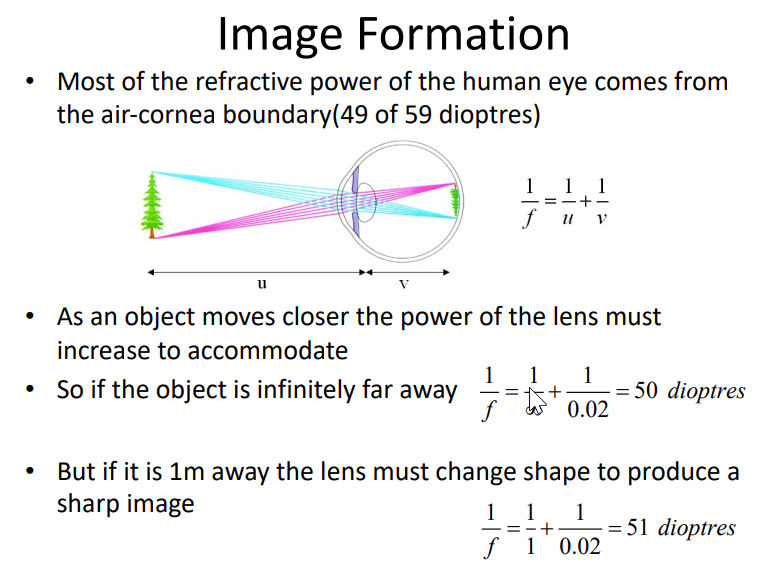
the back of the eyes is not flat..P34
Retina
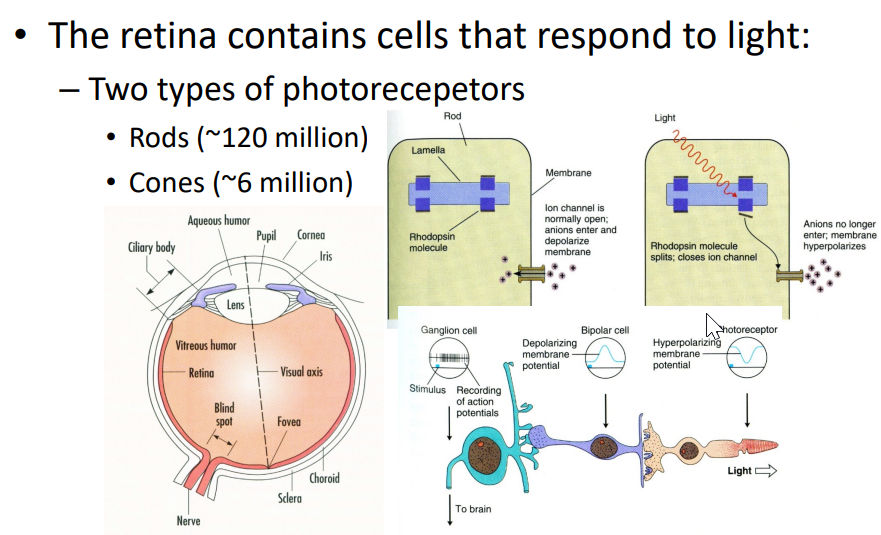
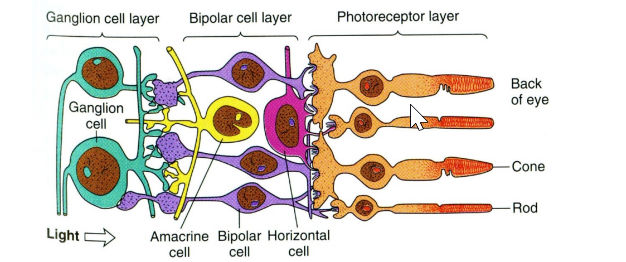
Contains two types of Photorecepetors
Rods (光杆) ~120M, sensitive but lack of spatial resolution as they converge to the same neuron within Retina.
Cones (视杆) ~6M, active at higher light levels with higher resolution as signal processed be several neurons.
Receptive Field
RF is the area on which light must fall for neuron to be simulated
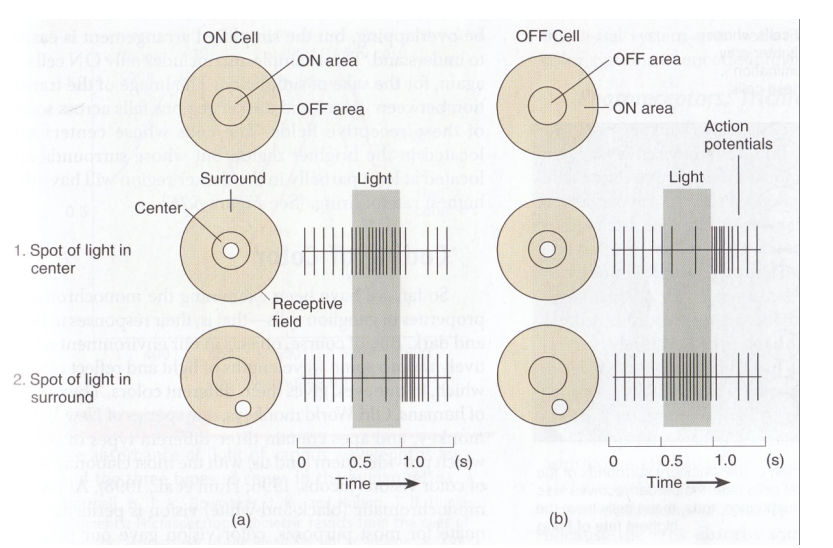
two types of Ganglion cells: : "on-center" and "off-center"
On-center: stimulated when the center of its receptive field is exposed to light, and is inhibited when the surround is exposed to light.
Off-center cells have just the opposite reaction
Lecture 1.2 - Human Vision (1).pdf P12 ~ 13
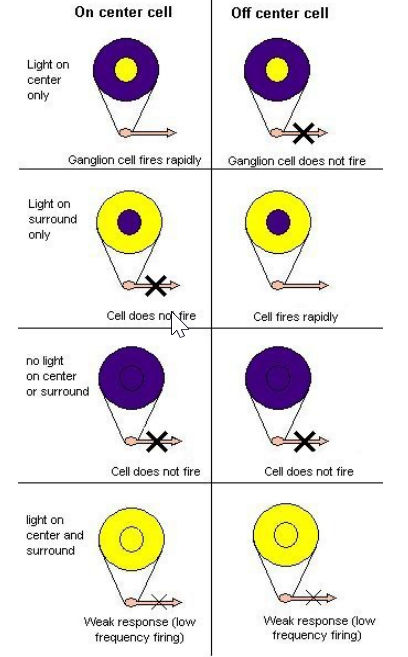
some ganglion cells are sensitive with the boundry…
Need more reading of the slides…..?
The rate of firing also tells info.
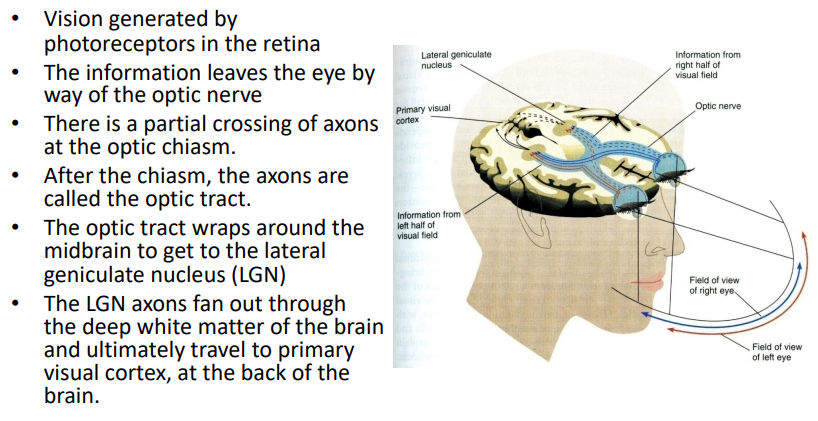
No.3 Not a total crossover? but a partial crossover. Cuz the brain needs info from both sides.
Vision generated by photoreceptors in the retina
The information leaves the eye by way of the optic nerve
There is a partial crossing of axons at the optic chiasm.
After the chiasm, the axons are called the optic tract. •
The optic tract wraps around the midbrain to get to the lateral geniculate nucleus (LGN)
The LGN axons fan out through the deep white matter of the brain and ultimately travel to primary visual cortex, at the back of the brain.
Where is the Color?
Three diff types of Cones.
Thrichromatic Coding…
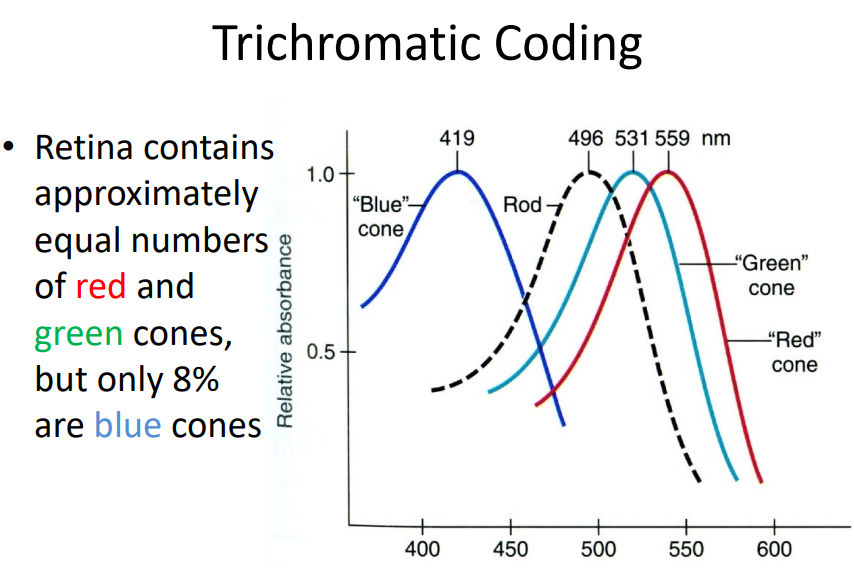
Why so less blue cones?
How to discriminate wavelengths 2nm in difference?
camera has filters allow only one type of color light to go through
Colour Mixing
But some colors do not exist?
One can imaging Bluish-green or Yellowish-green, But NOT Greenish- red or Bluish-yellow!
Many forms of colour vision proposed – Until recently some hard to disapprove •
1930s: Hering (German Physiologist) suggested colour may be represented in visual system as ‘opponent colours’
Yellow, Blue, Red and Green – Primary colours
Trichromatic theory cannot explain why yellow is a primary colour
Opponent Process Coding
Bluish green, yellowish green, orange (red and yellow), purple (red and blue) OK
Reddish green?? Bluish Yellow??
Opposite to each other

Excitation and inhibition cancel each other; no change in signal.
We have Red-green Ganglion cell and Yellow-blue ganglion cell.
Week 2
Edge Detection
image scale function in matlab
squeeze -> edge more visible
Gradient of the intensity, namely how fast the pixel changing in intensity:
Operators or Masks
2 by 2 matrix for the conner:

Robert
Sobel
Then we can get a gradient matrix, by apply threshold we can get a binary edge image.
Edge value is actually comply Gaussian Ditribution, but can be quite noisy.
If we set up a threshold, we may get multi-border lines. Thus the utilization of Canny.
Gaussian (Canny) edge detection
Apply Gaussian filter to smooth the image in order to remove the noise
Find the intensity gradients of the image, using Roberts, Prewitt, or Sobel, etc.
Apply gradient magnitude thresholding or lower bound cut-off suppression to get rid of spurious response to edge detection
Apply double threshold to determine potential edges
Track edge by hysteresis: Finalize the detection of edges by suppressing all the other edges that are weak and not connected to strong edges.
Filtering
Highly Directed Work
Second order operators
Thresholding
Mean filter:
random distributed noisy (even out positive and negative noise)
Gaussian Filter:

Laplacian Operator
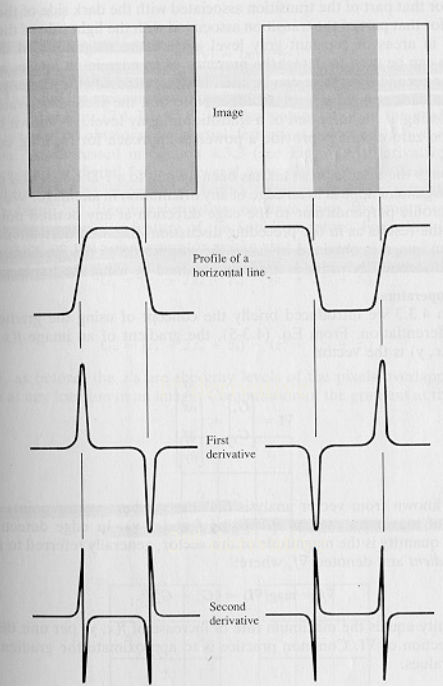
It is good to have Second Derivative, zero crossing points can be a good edge estimator, but not robust for noise.
So
Advanced Edge Detection
What cause intensity changes?
Gemetric:
surface orientation, depth, color and texture discontinuities
Non-geometric:
illumination, specularities (镜面反射), shadows and inter-reflections.

Edge Descriptors
Direction - perpendicular to the direction of maximum intensity change (i.e., edge normal)
Strength - related to the local image contrast along the normal
And Position

Main Step in ED
(1) Smoothing: suppress as much noise as possible, without destroying true edges.
(2) Enhancement: apply differentiation to enhance the quality of edges (i.e., sharpening)
(3) Thresholding: determine which edge pixels should be discarded as noise and which should be retained (i.e., threshold edge magnitude).
(4) Localization: determine the exact edge location.
Upsample: sub-pixel resolution might be required for some applications to estimate the location of an edge to better than the spacing between pixels

But it is super noise..

h is a Gaussian filter, but sliterly blur my edge

instead conv of h and f, we can also take differentiated G which saves one operation

Prewitt Operator

Practical Issue
Noise suppression-localization tradeoff.
– Smoothing depends on mask size (e.g., depends on σ for Gaussian filters).
– Larger mask sizes reduce noise, but worsen localization (i.e., add uncertainty to the location of the edge) and vice versa

We want good localzation and single response.
Canny Edge Detector


I got a thick edge, but not I chose the local maximum of the edge gradient direction.
Non-maxima suppression
Check if gradient magnitude at pixel location (i,j) is local maximum along gradient direction
Hysteresis thresholding
Standard thresholding can only select “strong” edges, does not guarantee “continuity”.


Scale Invariant Feature Transform (SIFT)
Given the noisy image, design the best suitable algorithm to detect edges.
Given the calculated edges, how would you quantify accuracy?
Why we want to match features?
Tasks like Object Recognition, Tracking…
Good features should be robust to all sorts of nastiness that can occur between images.
Types of invariance:
illumination
Scale
Rotation
Affine
Full Perspective


How to achieve illumination invariance?
The easy way (normalized) - histogram
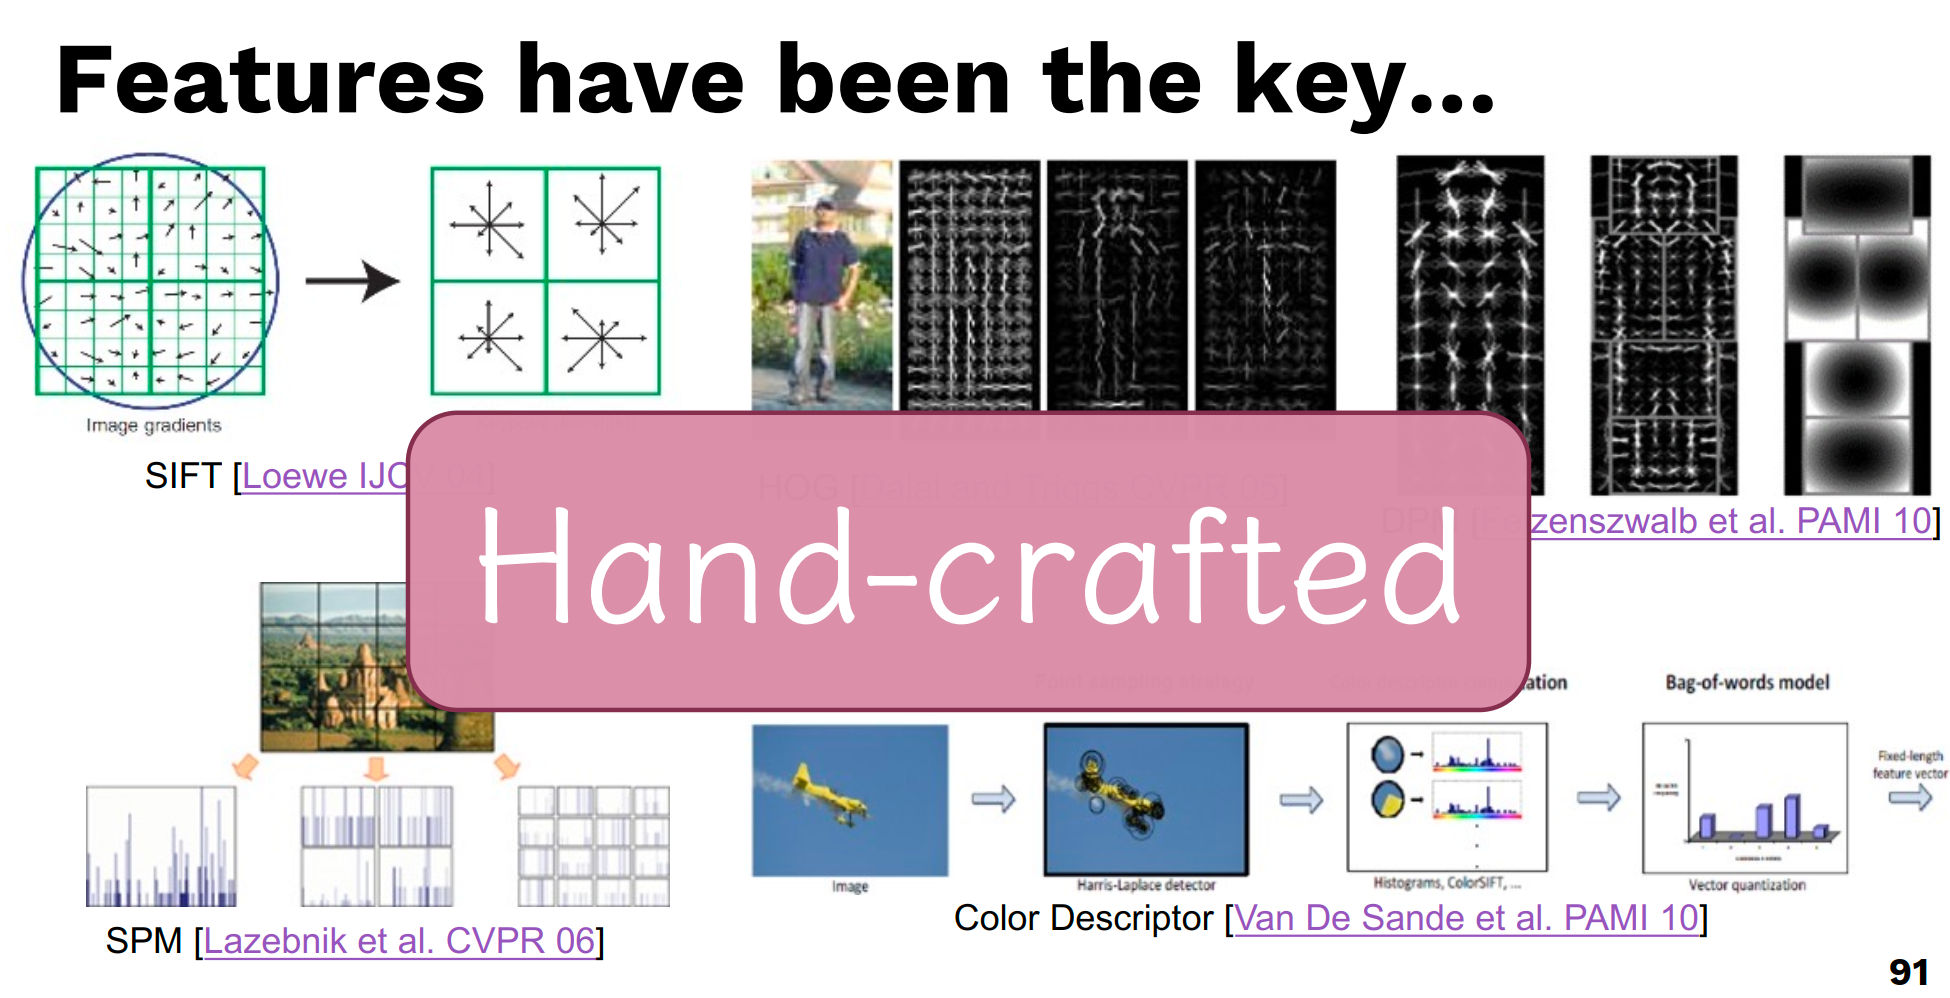
Difference based metrics (sift)
How to achieve scale invariance?
Pyramids
Down Sampling
Repeat until image is tiny
Run filter over each size image and hope its robust

Scale Space (Different Of Gaussian (DOG) method) ?# Todo
Pyramid but fill gaps with blurred images
not down sampling, but blurring it..
Like having a nice linear scaling without the expense
Take features from differences of these images
If the feature is repeatably present in between Difference of Gaussians it is Scale Invariant and we should keep it.

Rotation Invariance
Rotate all features to go the same way in a determined manner
Take histogram of Gradient directions
Rotate to most dominant (maybe second if its good enough
If rotation, looking at the histogram: will be same distribution but offset.
Handout 4.2
Hough Transform
Polar Space and Cartesian Space
coordinaties
Distance from the origin


The Hough transform is a common approach to finding parameterised line segments (here straight lines
The basic idea:
Each straight line in image can be described by an equation (
Each isolated point can lie on an infinite number of straight lines.
In the Hough transform each point votes for every line it could be on.
The lines with the most votes win.
Hough Space
(

It also conduct NMS to gain the best edge.
We need to set a threshold
A hough map

There are generalised versions for ellipses, circles
For the straight line transform we need to supress non-local maxima
The input image could also benefit from edge thinning
Single line segments not isolated
Will still fail in the face of certain textures
Circle Hough Transform

Hough transform technique is that it is tolerant of gaps in feature boundary descriptions and is relatively unaffected by image noise, unlike edge detecto
Lecture 5. Image Registration
Segmentation of Ageing brain

atlas 地图集
Geometric (and Photometric) alignment of one image with another
Implemented as the process of estimating an optimal transformation between two images.
Images may be of same or different types (MR, CT, visible, fluorescence, ...)
Co-register the image


Landmarks: eyes, ears etc. or curve of features
Image values: conservation of intensity

need same dimension of resolution
hard to handle different features

different pixels value are more likely to belong to different group.
The joint histogram


Class of Transforms:
Rigid, not scaling (6-dimension)


Affine

Piecewise Affine
Typically use different affine transformation for different parts of the image

Non-rigid (Elastic)
some shrinking, some expanding or deforming
External forces drive transformation, Internal forces provide constraints.

What similarity criterion to use?

maintain the distances between features.

RMS
Mutual Info

maximize the possibility of the location given the pixel.
what is

What is Normalised cross-correlation?
Computational Vision
Spatial resolution: Pixel Size
Intensity resolution: Bits per pixel
Time resolution: Frames per sec.
Spectral resolution: Number of bands + bandwidth
Characterising images as signals
Image Statistics
Mean, standard deviation
Histogram: frequency distribution graph
Signal-to-noise (SNR)


Non-automated: taking 5~6 and average through.
Histogram-based segmentation

Thresholding challenges

How do we determine the threshold ?
Different regions / image areas may need different levels of threshold.
Many approaches possible
Interactive threshold
Adaptive threshold
Variance minimisation method (Otsu threshold selection algorithm)
What is the OTSU? #TODO
Mathematical Morphology


Dilation
adding a “layer” of pixels to the periphery of object
Erosion
removing a “layer” of pixels all round an object
Two advanced segmentation methods
Active contours (snakes)
Watershed
Level-set methods # TODO
Active shape model segmentation # TODO
Active contours (snakes)


Watershed Segmentation


(Active) 3D Imaging and 3D
About touching the world…

Robotic Manipulation
https://www.cs.bham.ac.uk/research/groupings/robotics

3D Imaging
It is hard for people to interpret the first image.
We can use both of them at the same time.

Depth versus distance

How to measure depth and distance?

Passive
Stereophotogrammetry
Structure from motion
Dapth from focus
Active
TOF
Structured light imaging
Photometric stereo
Stereophotogrammetry
But hard to process related image (i.e. find the matching pixels)


Structure from motion
we have one camera, but moving…


predict where the canvas is, and needs more prior knowledge like the location of the camera.
Depth from focus
move the lens that focus..
looking for sharp edges, but not any time that emerges.

It is possible but it is quite noisy.
Passive

Active Stereophotogrammetry
R200 Camera
Can project surface features
Multiple camera still do not interfere with each other
Holes if you don’t find correspondence.

TOF
noisy when multiple objects, so we only look at one direction at once.

We now have a wave, so a wave bouncing back..
collect different pixel at different time..

Dmitry..
Structured Light


Phase wrapping and unwrapping


Photometric stereo
goal is not the depth, but the surfaces…


3D Structure Data
convert depth data into point cloud


Try to find the function to build surfaces (gradient)

Representations: Untextured mesh and textured mesh


Collecting multiple views of a scene (world coordinates)
Robot coordinates


How to combine point cloud?


ICP algorithm


Multi-steps…


ICP…
Others

Principal Components Analysis (PCA)
Covariance
measure of how much each of the dimensions vary from the mean with respect to each other
Covariance Matrix

Diagonal is the variances of x, y and z
N-dimensional data will result in NxN covariance matrix
How to interpret covariance?
The value itself that it doesn’t mean anything, but can use to determine the correlation and its sign.
If it is 0: they are independent.
PCA
It can simplify a dataset
A linear transformation that chooses a new coordinate system for the data set such that:
greatest variance by any projection of the data set comes to lie on the first axis (then called the first principal component),
the second greatest variance on the second axis,
and so on
It eliminates the later components for reducing dimensianlity.
The dimensions in PCA will be orthonal.
What is the principal component.
By finding the eigenvalues and eigenvectors of the covariance matrix, we find that the eigenvectors with the largest eigenvalues correspond to the dimensions that have the strongest correlation in the dataset.
PCA is a useful statistical technique that has found application in:
fields such as face recognition and image compression
finding patterns in data of high dimension
Basic Theory

Then, we gain the covariance matrix:

N can be the number of pixels in an image.

How much that features contribute, and choose the top-k features.

Example


Singular Value Decomposition (SVD)


Face Recognition (Not Detection)
Ideas:
Eigenfaces: the idea
Eigenvectors and Eigenvalues
Co-variance
Learning Eigenfaces from training sets of faces
Recognition and reconstruction
Eigenfaces
Think face as a combination of some components of faces.
These basis faces can be differently weighted to represent any faces
So we can use different vectors of weights to represent faces.

How do we pick the set of basis faces?
Statistical criterion for measuring the notion of “best representation of the differences between the training faces”
How to learn?

training set rearrange into 2Dmatrix…
Rows: Each value, Columns: Each pixel value
Calculate Co-variance matrix
Then find the eigenvectors of that covariance matrix.
Sort by eigenvalues and find the top-features.
Get the principal components
Image space to face space.

Recognition in face space

The cloest face in the face space is the chosen match.
But if with hat or glasses ???
Image registration
Some Books

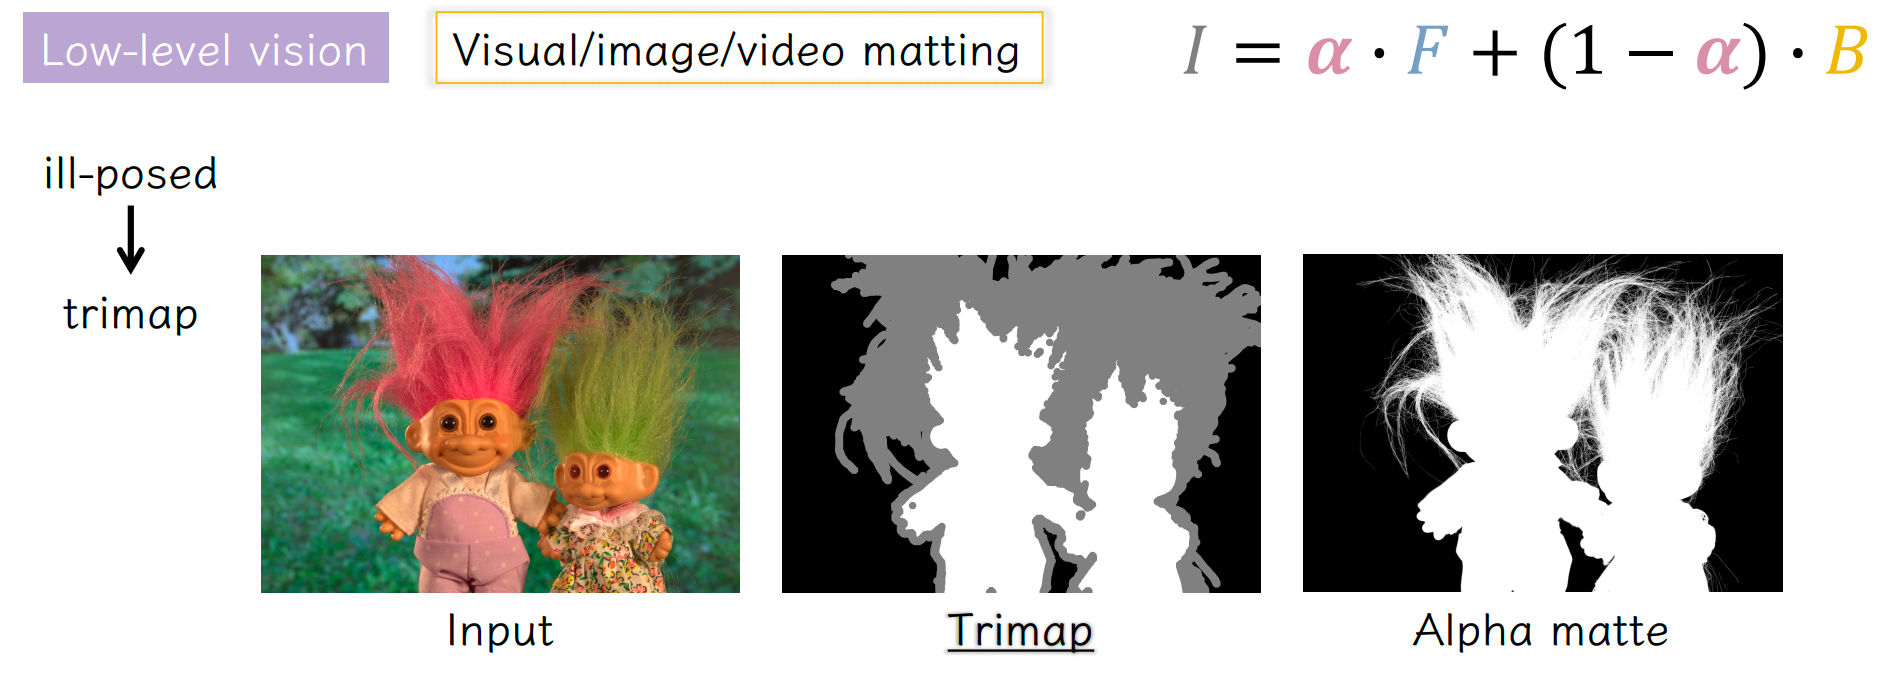
Image Matting Problem


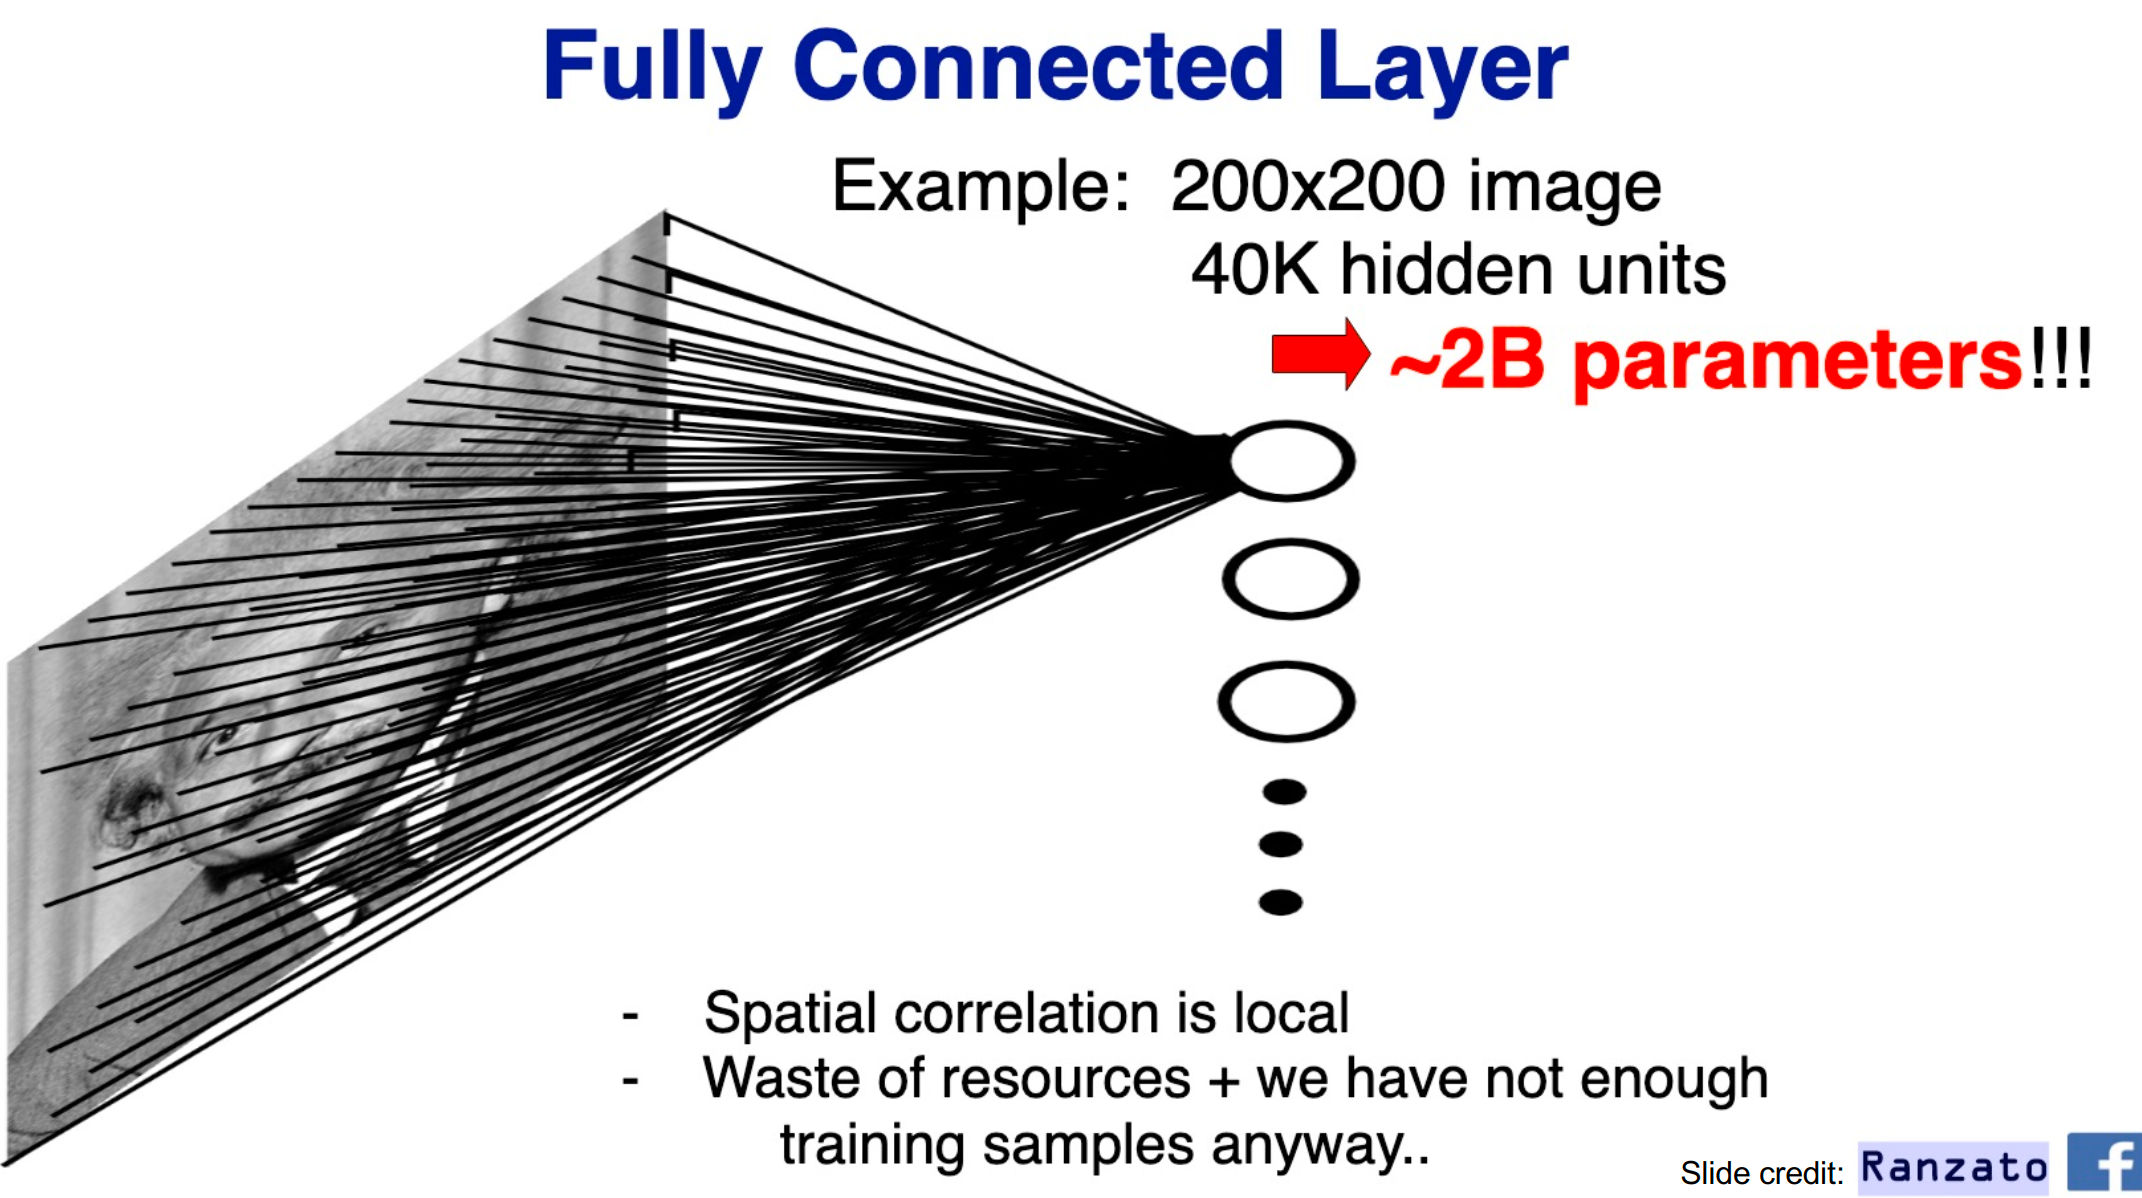
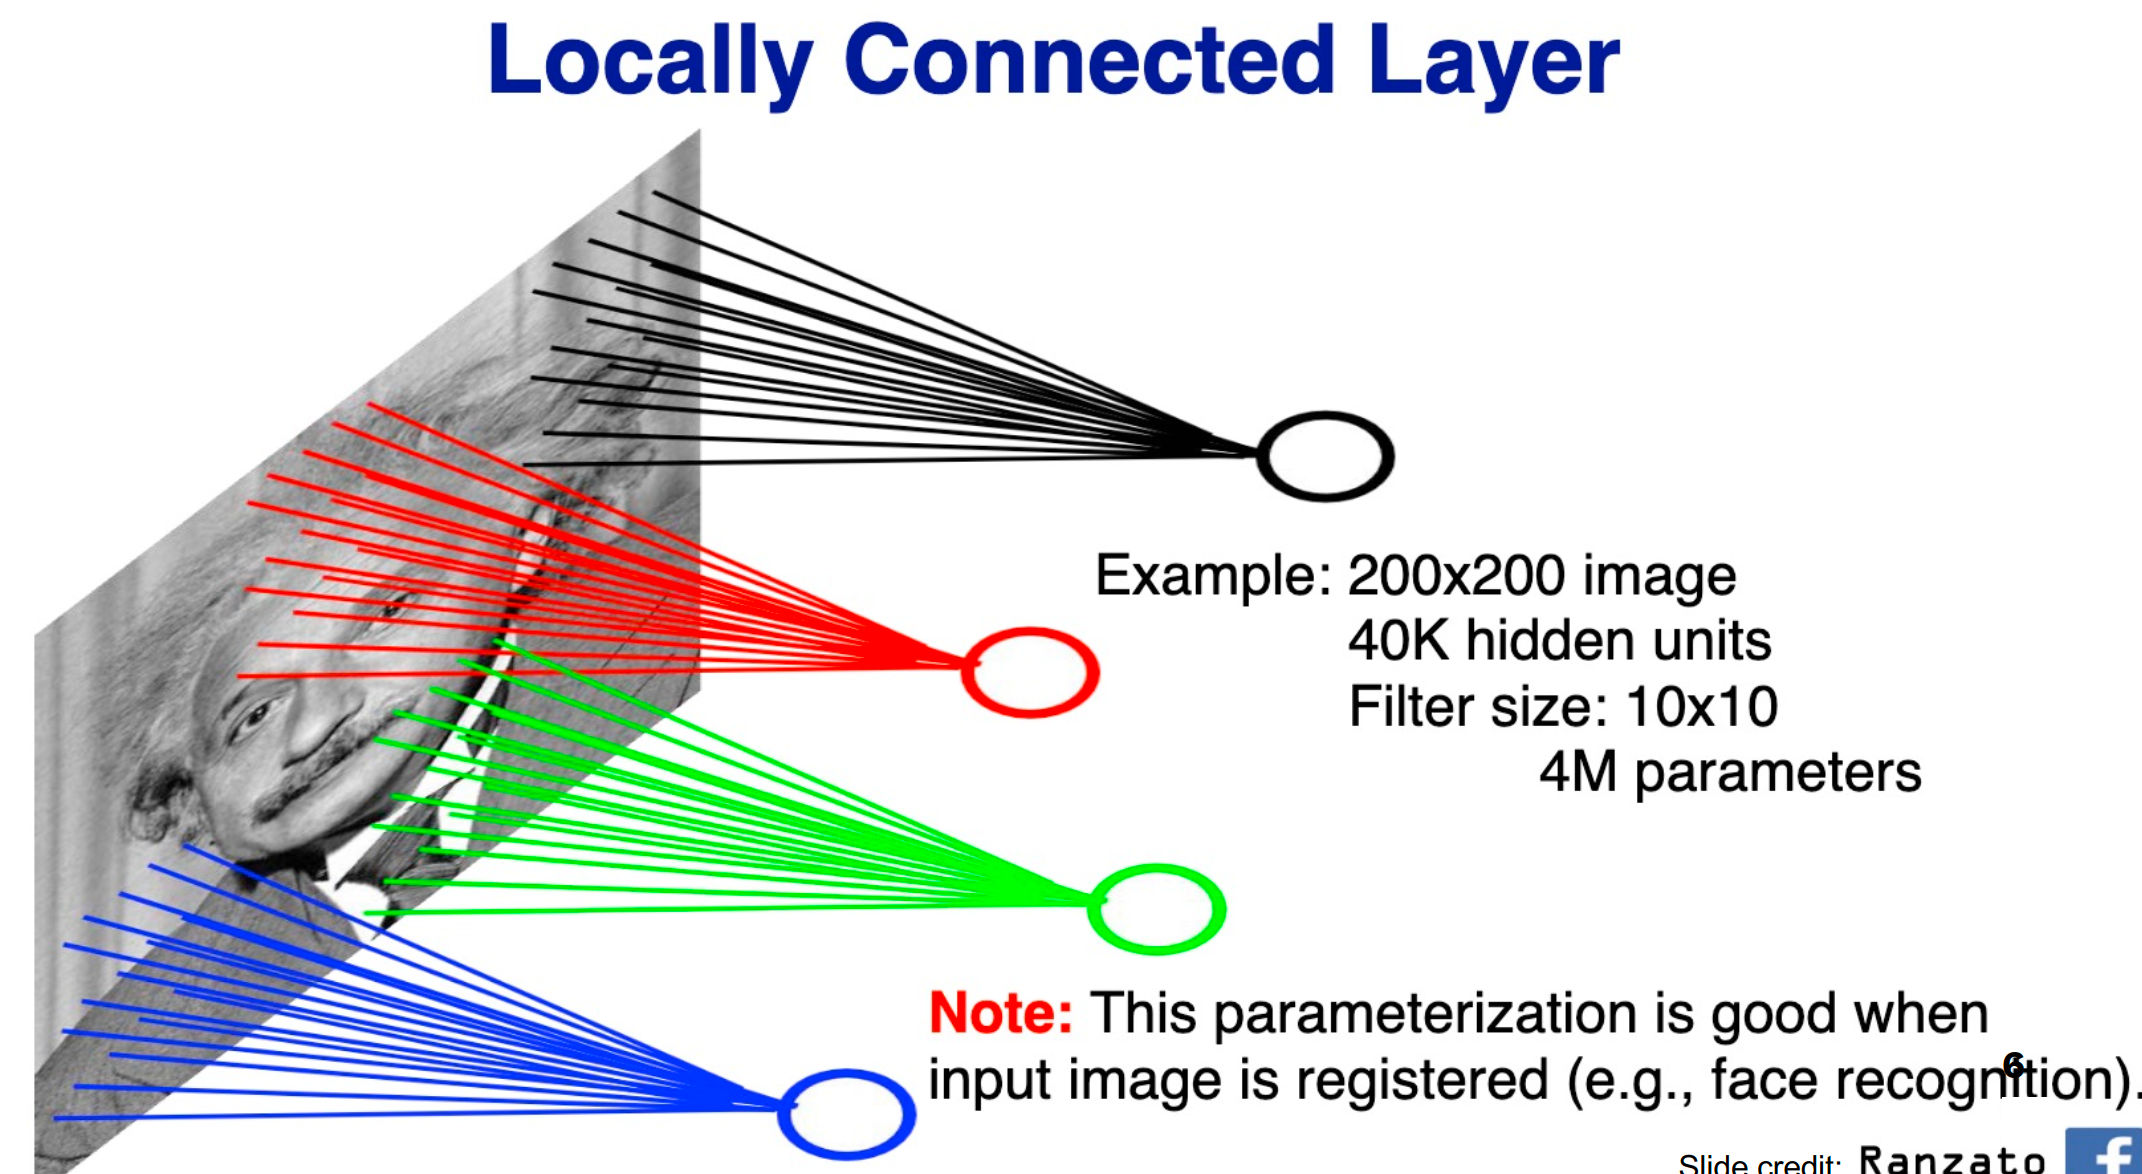
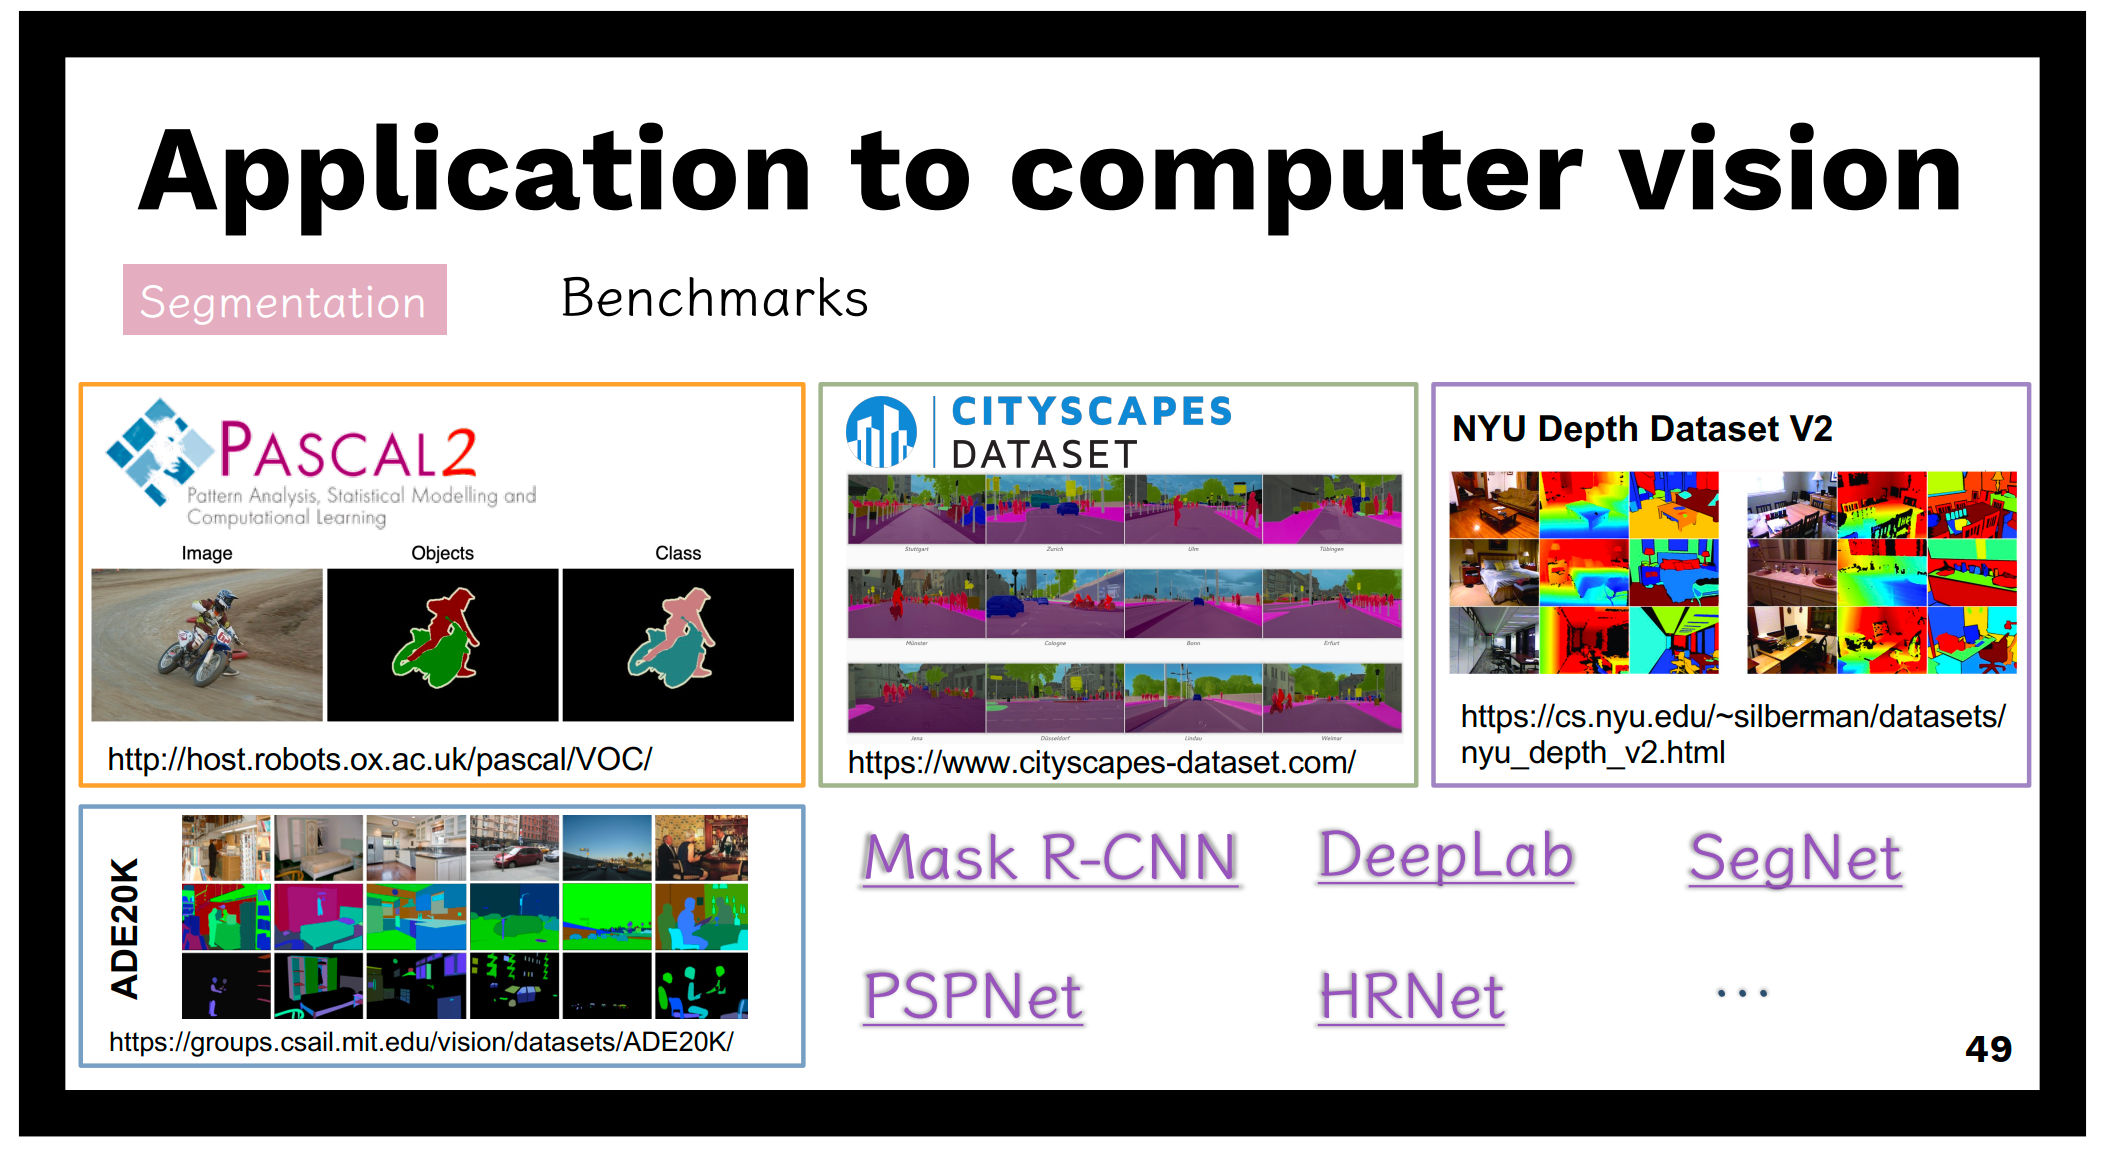
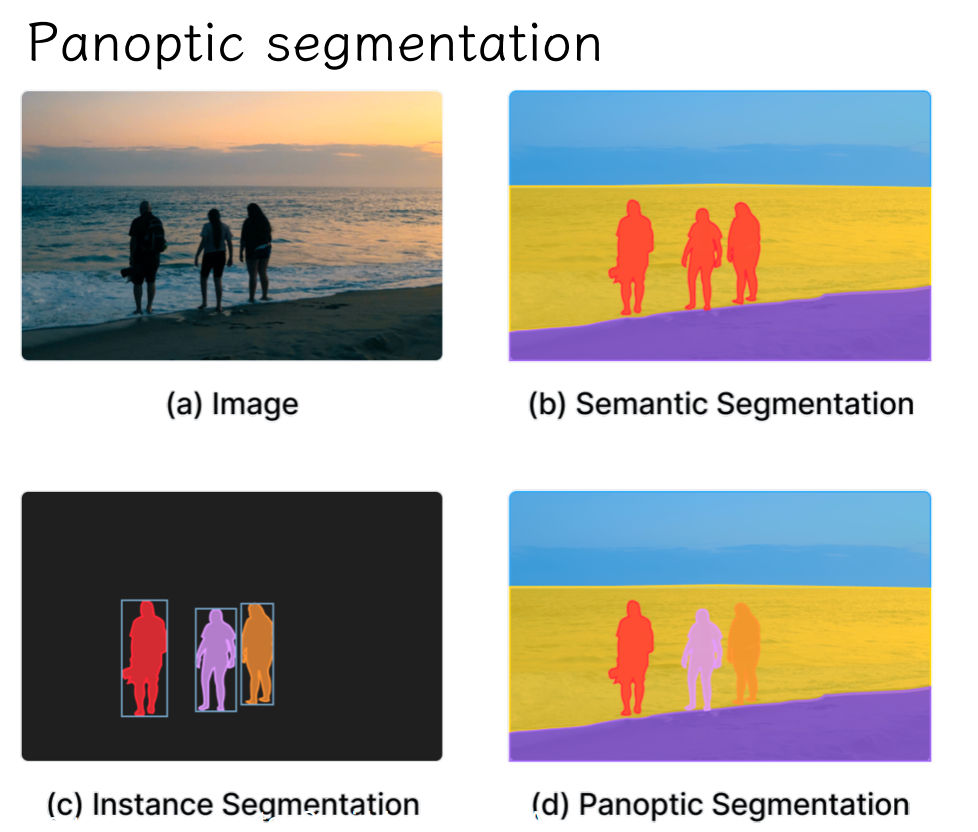
Open Source Detectron2 based on PyTorch

Temporal superresolution

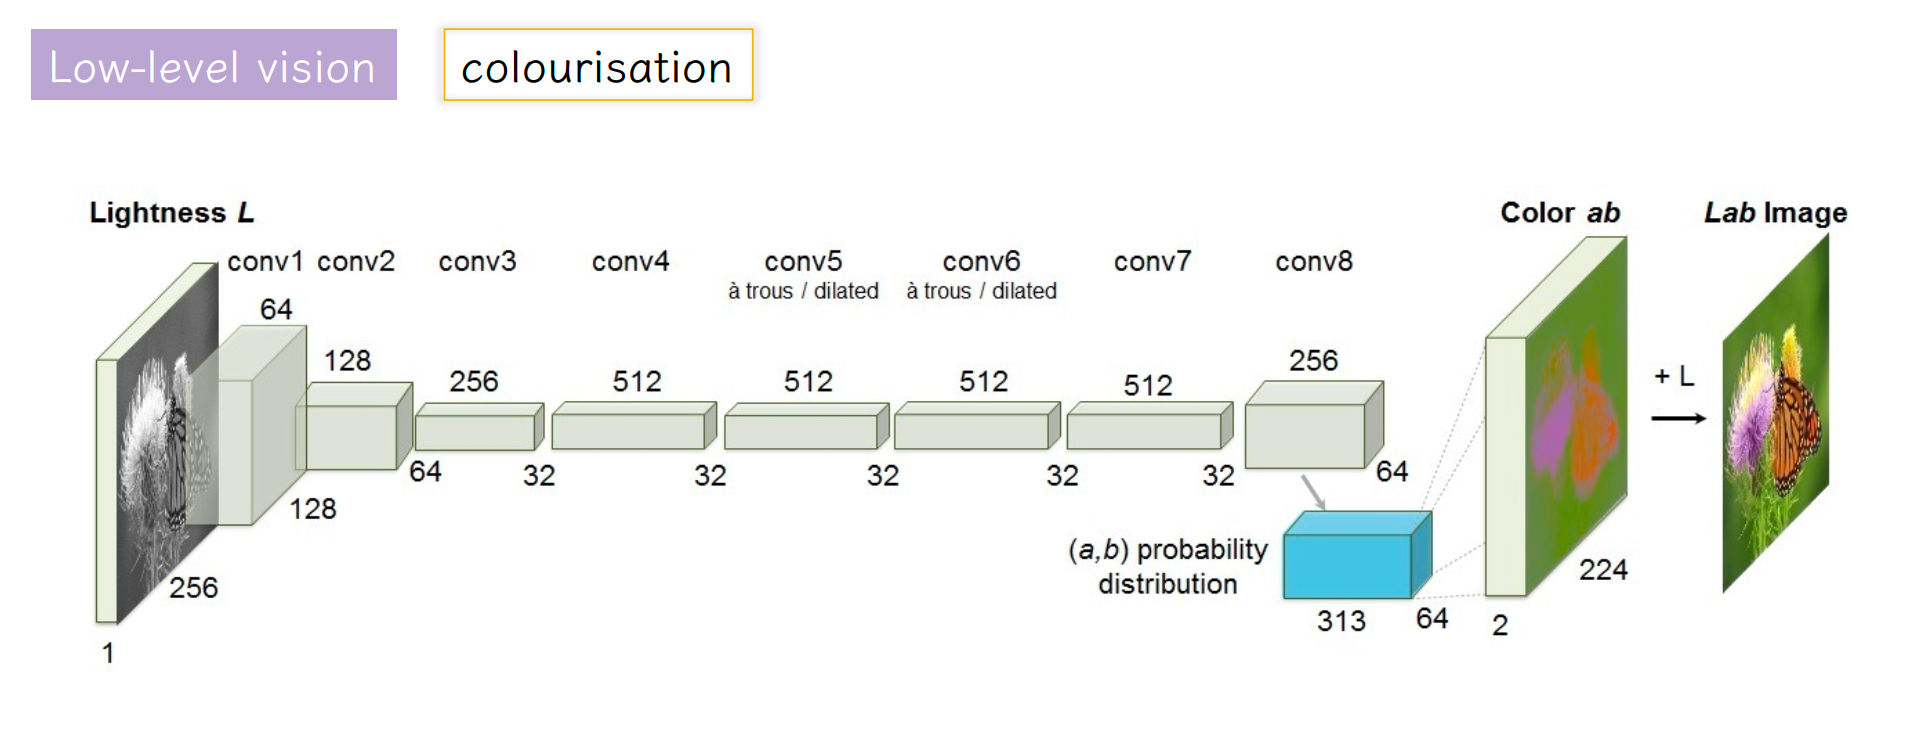




Initialisation:
